Pictures
File Info
| Updated: | 05-17-06 04:45 AM |
| Created: | unknown |
| Downloads: | 4,104 |
| Favorites: | 23 |
| MD5: |
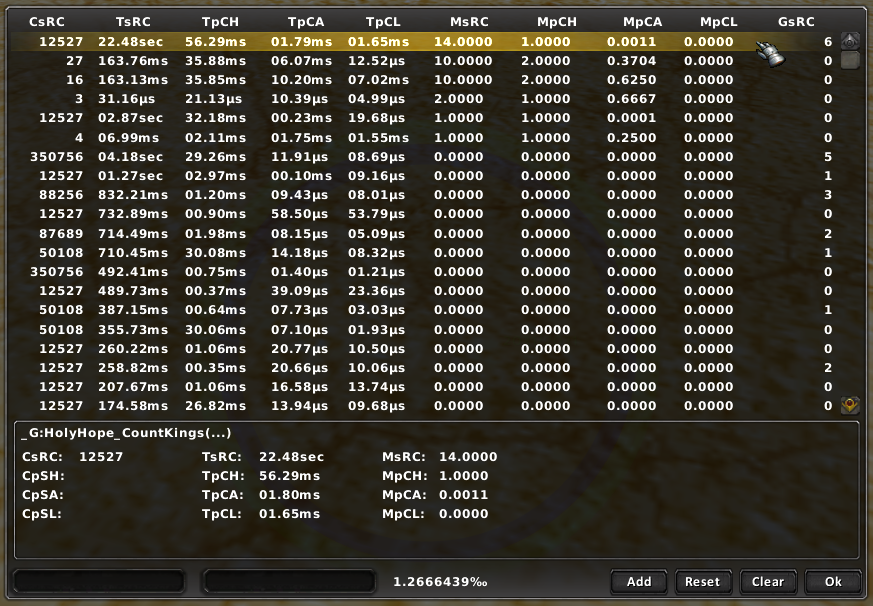
LuaProfiler
 )
)Optional Files (0)
 |
Comment Options |
 04-20-06, 09:51 PM
|
|
|
A Deviate Faerie Dragon
Forum posts: 15
File comments: 6
Uploads: 4
|
|

|

|
|
04-21-06, 09:12 AM
|
|
|
A Black Drake
Forum posts: 80
File comments: 15
Uploads: 4
|
official discussion thread
|
|
|
|
|
04-22-06, 03:53 AM
|
|
|
A Kobold Labourer
Forum posts: 1
File comments: 1
Uploads: 0
|
|
|
|
|
|
04-22-06, 07:32 AM
|
|
|
A Black Drake
Forum posts: 80
File comments: 15
Uploads: 4
|
|
|
|
|

|
04-22-06, 11:39 AM
|
|
|
A Kobold Labourer
Forum posts: 0
File comments: 2
Uploads: 0
|
|
|
|
|
|
04-22-06, 01:46 PM
|
|
|
A Black Drake
Forum posts: 80
File comments: 15
Uploads: 4
|
|
|
|
|
|
04-28-06, 06:36 PM
|
|
|
A Defias Bandit
Forum posts: 3
File comments: 56
Uploads: 0
|
Last edited by Shark : 04-28-06 at 06:36 PM.
|
|
|
|
|
04-30-06, 04:37 PM
|
|
|
A Black Drake
Forum posts: 80
File comments: 15
Uploads: 4
|
|
|
|
|
|
05-04-06, 07:10 PM
|
|
|
A Kobold Labourer
Forum posts: 0
File comments: 4
Uploads: 0
|
Last edited by Tinkerboom : 05-04-06 at 07:12 PM.
|
|
|
|
|
05-06-06, 02:10 AM
|
|
|
A Defias Bandit
Forum posts: 3
File comments: 56
Uploads: 0
|
|
|
|
|
|
05-06-06, 02:13 AM
|
|
|
A Black Drake
Forum posts: 80
File comments: 15
Uploads: 4
|
|
|
|
|
|
05-06-06, 02:14 AM
|
|
|
A Black Drake
Forum posts: 80
File comments: 15
Uploads: 4
|
Last edited by wereHamster : 05-06-06 at 02:18 AM.
|
|
|
|

|
05-06-06, 11:18 PM
|
|
|
A Defias Bandit
Forum posts: 3
File comments: 56
Uploads: 0
|
|
|
|
|
|
05-07-06, 12:46 AM
|
|
|
A Black Drake
Forum posts: 80
File comments: 15
Uploads: 4
|
|
|
|
|
|
05-07-06, 06:47 AM
|
|
|
A Kobold Labourer
Forum posts: 0
File comments: 4
Uploads: 0
|
|
|
|
|
|